Selecting the Highest Calibre Health Research Leaders for CIHR'S Foundation and Project Grant Programs
A Bibliometric Study of the Reformed Peer Review Process
Observatoire des Sciences et des Technologies
November 2016
Table of contents
- Introduction and Context
- Methods
- 2.1. Database
- 2.2. Target Population and Sample
- 2.3. Reconstitution of Publications Files
- 2.4. Indicators
- Results
- 3.1. Foundation Grant Program
- 3.2. Project Grant Program
- 3.3. Benchmark indicators
- Conclusion
- Appendix
Tables
| Table 2-1 | Population and Selected Studied Group of Applicants to Foundation and Project Grant Programs by Funding Status (2014-2016) |
| Table 2-2 | Population and Sample of Unfunded Applicants in Each Competition by Status in the Two Other Competitions (always unfunded or sometimes funded) |
| Table 2-3 | Number of Applicants and Applications in Selected Studied Group by Competition and Funding Status (2014-2016) |
| Table 4-1 | Matching Study Questions, Conclusions and Figures |
Figures
| Figure 3-1 | Number of Publications and Impact of Papers from Foundation Grant Program Applicants (2014 & 2015) by Application Status for an Observation Window of 7 Years Prior to Competition |
| Figure 3-2 | Collaboration and Acknowledgment in Papers from Foundation Grant Program Applicants (2014 & 2015) by Application Status for an Observation Window of 7 Years Prior to Competition |
| Figure 3-3 | Number of Publications, Impact of Papers and Acknowledgments from Foundation Grant Program Applicants by Competition Year and Funding Status for an Observation Window of 7 Years Prior to Competition |
| Figure 3-4 | Number of Publications and Impact of Papers from Project Grant Program's Applicants (2016) by Application Status for an Observation Window of 7 Years Prior to Competition |
| Figure 3-5 | Collaboration and Acknowledgment to CIHR in Papers from Project Grant Program Applicants (2016) by Application Status for an Observation Window of 7 Years Prior to Competition |
| Figure 3-6 | Average of Relative Impact Factors (ARIF) of Health Research Papers from Foundation and Project Grant Programs Applicants and from OECD Countries, 2008-2015 |
| Figure 3-7 | Average of Relative Citations (ARC) of Health Research Papers from Foundation and Project Grant Programs Applicants and from OECD Countries, 2008-2015 |
| Figure 5-1 | Number of Publications and Impact of Papers from Foundation Grant Program Applicants by Competition Year and Application Status for an Observation Window of 7 Years Prior to Competition |
| Figure 5-2 | Publications in Collaboration and Acknowledgment in Papers from Foundation Grant Program Applicants by Competition Year and Application Status for an Observation Window of 7 Years Prior to Competition |
| Figure 5-3 | Number of Publications and Impact of Papers from Foundation Grant Program Applicants (2014 & 2015) by Application Status for an Observation Window from 2000 to One Year Prior to Competition |
| Figure 5-4 | Collaboration and Acknowledgment to CIHR in Papers from Foundation Grant Program Applicants (2014 & 2015) by Application Status for an Observation Window from 2000 to One Year Prior to Competition |
| Figure 5-5 | Number of Publications and Impact of Papers from Project Grant Program Applicants (2016) by Application Status for an Observation Window from 2000 to One Year Prior to Competition |
| Figure 5-6 | Collaboration and Acknowledgment to CIHR in Papers from Project Grant Program Applicants (2016) by Application Status for an Observation Window from 2000 to One Year Prior to Competition |
| Figure 5-7 | Growth Rate of Number of Papers from the 2000-2007 period to the 2008-2015 period by Grant Program and Funding Status |
Acknowledgment
The Observatoire's team thanks Kwadwo (Nana) Bosompra and Shevaun Corey from CIHR for their valuable comments and suggestions throughout the project.
1 Introduction and Context
As part of the ongoing reform of its open suite of programs, CIHR recently introduced two distinct funding programs to support investigator-initiated health research. The Foundation Grant Program (FGP) is designed to contribute to a sustainable foundation of health research leaders by providing long-term support for the pursuit of innovative, high-impact programs of research while the Project Grant Program (PGP) is designed to capture ideas with the greatest potential for important advances in health-related knowledge, the health care system, and/or health outcomes, by supporting projects with a specific purpose and a defined endpoint.Footnote 1 The two programs were introduced with reformed peer review processes for selecting applicants for funding.
The FGP involves a three-stage competition and review process. Stage 1 focuses on the caliber of the applicant(s), their vision and program direction. If they are successful at Stage 1, applicants are invited to complete a Stage 2 application, which is assessed on the quality of the proposed program of research and the quality of the expertise, experience and resources. Following this assessment, the group of applicants is split into three subgroups. 1) the "green zone" subgroup is made up of the highest ranked applications and considered for funding without further discussion, 2) the "red zone" subgroup is made up of the bottom-ranked applications and are deemed unsuccessful and not considered for funding, and 3) the "grey zone" subgroup is made up of applications which are highly ranked, but with large standard deviations due to discrepancies in reviewers' scores. Applications in the "grey zone" are moved to Stage 3 assessment which involves a face-to-face committee meeting where final decisions for funding are made.
Hence, among the applications submitted to the FGP, we can distinguish the following five categories:
- Rejected at Stage 1;
- Rejected at Stage 2 (red zone);
- Funded at Stage 2 (green zone);
- Included in Stage 2 (grey zone), and rejected at Stage 3;
- Included in Stage 2 (grey zone), and funded at Stage 3.
The PGP review process involves only two stages. At Stage 1, applications are assessed and split into three groups similar to the latter stages of the FGP: a "green zone" subgroup is made up of funded researchers, a "red zone" subgroup is made up of rejected applicants, and a "grey zone" subgroup is made up of applications close to the funding cut-off and then forwarded to Stage 2, where they are submitted to a face-to-face committee meeting for a final decision on funding.
Hence, the PGP review process produces four categories of applications:
- Rejected at Stage 1 (red zone);
- Funded at Stage 1 (green zone);
- Included in Stage 1 (grey zone), and rejected at Stage 2;
- Included in Stage 1 (grey zone), and funded at Stage 2.
The objective of the proposed study is to assess, through bibliometrics, the extent to which CIHR's reformed peer review process is able to select the highest caliber researchers for the Foundation Grant Program and the best and most feasible research ideas for the Project Grant Program. The study also examines the extent to which the two programs are attracting outstanding health researchers by comparing the pool of applicants to health researchers from Canada, from selected Organization for Economic Cooperation and Development (OECD) countries and from the rest of the world in terms of their bibliometric indices.
More specifically, the questions addressed in this study are as follows:
- Is the peer review process selecting the most high caliber health researchers for the Foundation and Project Grant Programs? That is, how do selected applicants compare with unselected applicants in terms of their bibliometric indices?
- How do applicants to the first Foundation Grant Program competition compare with those to the second FGP competition in terms of bibliometric indices?
- Do peer reviewers appear to be using the same criteria to select applicants in both the Foundation and Project Grant Programs? That is, is the association between peer review rankings and bibliometric indices the same or different in the Foundation and Project Grant Programs?
- Are the Foundation Grant and Project Grant Programs attracting the most high caliber health researchers? That is, how do the respective applicant pools (the funded ones as well as the unfunded ones) compare with health researchers in Canada, selected OECD countries and the rest of the world, in terms of their bibliometric indices?
According to our working hypothesis, the ranking produced by the bibliometric indicators among the various categories of applicants would be (more or less) in accordance with the decisions of the peer review committees. Thus, in the case of the Foundation Grant Program where applicants' previous achievements are considered as a major assessment criterion, the applicants funded at Stage 2 (green zone) would score better than those (from the grey zone) funded at Stage 3. The latter would score better than those included in Stage 2 (grey zone) but rejected at Stage 3. Along the same lines, applicants rejected at Stage 3 would have better scores than those rejected at Stage 2, while those rejected as Stage 1 will be ranked last. Hence, in increasing order of bibliometric scores, the five categories of applicants would be ranked as follows:
- Rejected at Stage 1
- Rejected at Stage 2
- Included in Stage 2 & Rejected at Stage 3
- Included in Stage 2 & Funded at Stage 3
- Funded at Stage 2
Note that bar charts depicting FGP bibliometric scores in the Results Section of this report will be presented in this ranked order.
In the case of Project Grant Program, things could be somewhat different, because applications are not assessed mainly on the basis of the career achievements of the applicants as is the case in the Foundation Grant Program, but more importantly on the relevance, the originality and the feasibility of the proposed research idea. In that sense, it is plausible that the correspondence between the successive stages of the peer review process and the bibliometric scores will not be as strong in the context of the Project Grant Program as it should be in the Foundation Grant Program.
If the four categories of PGP applicants were to be ranked in ascending order of bibliometric scores, they would be as following:
- Rejected at Stage 1
- Rejected at Stage 2
- Funded at Stage 2
- Funded at Stage 1
Note that bar charts depicting PGP competition bibliometric scores in the Results Section of this report will be presented in this ascending order.
2 Methods
This section presents the database and the methods used to select the studied group of researchers and to produce the bibliometric indicators.
2.1 Database
The bibliometric data presented here are drawn from the Canadian Bibliometric Database (CBD) built by the Observatoire des sciences et des technologies (OST) using Thomson Reuters' Web of Science (WoS). The WoS includes three databases (the Science Citation Index Expanded™ [SCI Expanded], the Social Sciences Citation Index™, and the Arts & Humanities Citation Index™) covering, in 2015, about 12,000 journals in all disciplines. The WoS is the staple database for bibliometric analyses, and indexes the most important journals of each disciplinary field based on their number of citations. Also, its coverage of scientific literature is consistent over time.Footnote 2 Although, PubMed offers a more comprehensive coverage of health sciences literature, unlike WOS it is not a "citation index", and therefore does not allow for the computation of scientific impact measures, which are essential indicators in the context of the present study. Another citation index that could be used for bibliometrics is the Scopus database which is built and maintained by Elsevier-Reed publishers.. However, literature shows that Scopus and the WoS produce highly comparable results.Footnote 3
It should be noted that, when designed and used thoroughly, bibliometrics indicators provide high quality measurement of research activity.Footnote 4 This is especially true for the health sciencesFootnote 5 where the vast majority of the relevant research results are published in journals indexed in the bibliometric databases.Footnote 6
The statistics presented here do not include all documents published by the studied researchers, since some works are disseminated through scientific media not indexed by the WoS (e.g., highly specialized journals, national journals, grey literature and particularly conference proceedings not published in journals). What these statistics do measure, however, is the share of researchers' scientific output that is the most visible for Canadian and worldwide scientific communities, and therefore that is most likely to be cited.Footnote 7
2.2 Target Population and Sample
This study examines two cohorts of applicants from 2014 and 2015 to the FGP and the 2016 cohort of applicants to the PGP competitions. Table 2-1 shows the breakdown of the applicant population by competition and funding status as well the corresponding breakdown for the sample.
As agreed with CIHR our method involves the reconstitution of the publications files (2000–2015) of 2000 researchersFootnote 8 who applied to one or more of the three competitions. It should be noted that the study includes the whole population of the applicants who were funded at least once in any of the three competitions (n. = 707). Among the 3,223 unfunded applicants (those who were unfunded in all three competitions), we also draw a random sample of 1,293 (about 40%) researchers. We controlled this sample for the distribution of researchers by competition, by sex, by pillar, by CIHR institute and by primary research class, and it proved to be properly representative of the whole population of the 3,223 applicants who were always unfunded (in these three competitions).
It should also be noted that the sum of applicants in each competition is greater than the total number of distinct applicants (shown in the last row of Table 2-1 ) because some researchers may have applied to more than one competition. This reality is also reflected in the sample. On the other hand, for each row, the sum of funded and (always) unfunded applicants equals the total number of applicants (column All applicants). If for a given competition a researcher has submitted more than one application, he/she is counted in Table 2-1 as funded, if at least one of his/her applications is funded.
Table 2-1 Population and Selected Studied Group of Applicants to Foundation and Project Grant Programs by Funding Status (2014-2016)
| Competitions | Type | Population | Studied Group | ||||
|---|---|---|---|---|---|---|---|
| Unfunded | Funded | All Applications | Unfunded | Funded | All Applications | ||
| 201409FDN | Foundation | 1,193 | 150 | 1,343 | 468 | 150 | 618 |
| 201509FDN | Foundation | 785 | 120 | 905 | 299 | 120 | 419 |
| 201409FDN and
201509FDN |
Both
Foundations |
1,533 | 270 | 1,803 | 595 | 270 | 865 |
| 201603PJT | Project | 2,569 | 468 | 3,037 | 1,039 | 468 | 1,507 |
| 201409FDN,
201509FDN and 201603PJT |
All 3
Competitions Distinct Counts |
3,223 | 707 | 3,930 | 1,293 | 707 | 2,000 |
The funding status of each researcher is assigned separately for each competition. The publication file of a researcher who is, for example, unfunded in 2014 but funded in 2016 is included in the group of unfunded applications for the analysis of the 2014 competition (FDN) and in the group of funded applications for the 2016 Project Grant competition (Competition code PJT). Also it is important to note that his/her publication file included in the analysis of the 2014 competition will not be identical to that of the 2016 competition, because in the latter competition, his/her file will include two more publication years.
All funded researchers are included in the analysis of the competition where they succeeded at, but they are not necessarily included in the analysis of the other competitions to which they participated and where they were unfunded. Since only 40.1% (1,293/3,223) of the always unfunded researchers are included in our studied group of unfunded applicants, including in this group all (100%) the researchers who have had a funded application in another competition would introduce a serious bias in our sample. Indeed, while the probability to be selected in the sample is at 40.1% for the always unfunded researchers, it would be at 100% for the researchers who were funded at least once. To avoid this bias, we made sure that the sampling fraction (the proportion of the population included in the sample) of researchers who are not always unfunded (who have been funded at least once) is, for each competition, the same as that of the researchers who were always unfunded (who were never funded). To do this, for each competition, we randomly selected among this subgroup a share of the population equal to the share of the population of the always unfunded researchers included in the sample. As shown in Table 2-2 the share of those researchers who were funded (at least once) in other competitions is about the same in our sample of unfunded applicants as it is in our population.
Table 2-2 Population and Sample of Unfunded Applicants in Each Competition by Status in the Two Other Competitions (always unfunded or sometimes funded)
| Competition | |||
|---|---|---|---|
| 201409FDN | 201509FDN | 201603PJT | |
| Population of unfunded | 1,193 | 785 | 2,569 |
| Always unfunded in the 3 competitions | 1,052 | 670 | 2,535 |
| Sometimes funded in the other competitions | 141 | 115 | 34 |
| Proportions of sometimes funded | 12% | 15% | 1% |
| Sample of unfunded | 468 | 299 | 1,039 |
| Always unfunded in the 3 competitions | 413 | 255 | 1,025 |
| Sometimes funded in the other competitions | 55 | 44 | 14 |
| Proportions of sometimes funded | 12% | 15% | 1% |
The analyses are also performed application by application, which means that the publication file of a researcher who submitted more than one application to a given competition can be counted under more than one application status if, for example, one application is funded and another is unfunded. It should be added that this can only happen in the Project Grant program (Competition Code PJT) since there is only one application per researcher and per competition in the Foundation Grant program (FDN) ), as shown on Table 2-3 . However, it should be noted that several researchers who were unfunded in the 2014 Foundation Grant program (FDN) also applied to the 2015 competition. This is why there are 865 distinct researchers in the two foundations, but 1,037 applications
Table 2-3 Number of Applicants and Applications in Selected Studied Group by Competition and Funding Status (2014-2016)
| Competitions | Type | Applicants | Applicants | ||||
|---|---|---|---|---|---|---|---|
| Unfunded | Funded | All | Unfunded | Funded | All | ||
| 201409FDN | Foundation | 468 | 150 | 618 | 468 | 150 | 618 |
| 201509FDN | Foundation | 299 | 120 | 419 | 299 | 120 | 419 |
| 201409FDN and
201509FDN |
Both
Foundations |
609 | 270 | 865 | 767 | 270 | 1,037 |
| 201603PJT | Project | 1,175 | 468 | 1,507 | 1,458 | 492 | 1,950 |
| 201409FDN,
201509FDN and 201603PJT |
All 3
Competitions Distinct Counts |
1,490 | 707 | 2,000 | 2,225 | 762 | 2,987 |
Researchers can submit more than one application to the Project Grant program (PJT) and they can also have more than one project funded. As shown in Table 2-3, in 2016, 1,507 researchers presented 1,950 applications and 468 successful applicants were funded for 492 projects.
As explained above, when a researcher submits more than one application in a given competition, his/her publication file can be related to more than one application status (if, for example, one of his/her applications is funded and another unfunded). On the other hand, within each application status, each publication is only counted once. Therefore, if two applications for a given researcher receive the same status, his/her publications will only be counted once. Along the same lines, if one of his/her publications were produced in collaboration (co-authored) with another researcher who submitted to the same competition, an application which received the same status, this publication will also only be counted once. Put in other words, regardless of the number of publication files or the number of applications it is related to, a given publication is only counted once in each application status for the comparison of bibliometric scores by application status.
2.3 Reconstitution of Publications Files
For each researcher selected in the samples, a complete publication file covering the 2000-2015 period was reconstituted through a two-part process. First, we ran an automatic matching of names contained in the list of FGP and PGP applicants with authors' names contained in the bibliometric database. Second, in order to avoid overestimating created by namesakes, we performed a manual review of each researcher's file.
Before the automatic matching occurred, we transformed the names of all the 2,000 selected researchers to correspond with the format of authors' names in the bibliometric database, since authors' names in the database do not include the authors' first names but only their initials. For example, "John W. Smith" was transformed into "Smith-JW" and also into "Smith-J" to make sure we retrieved publications where the middle name (or initial) was omitted. Then, we ran an automatic matching process which preselected, for each researcher, all the Canadian papers bearing his/her name as author between 2000 and 2015. This crude matching retrieved 171,066 papers. In a second step, we manually removed the publications that were wrongly assigned to a researcher with the automatic matching procedure. This manual validation reduced the number of the Foundation and Project Grant Programs applicants' papers to 88,446 over the 2000-2015 period.
2.4 Indicators
In order to assess the scientific production of the Foundation and Project Grant Programs applicants, the following indicators are produced from the clean publication files of the researchers included in this study. These indicators are broken down by application status and competition year.
- Number of publications
- Average annual number of publications;
- Growth rate of the number of publications for two time periods (2000-2007 and 2008-2015);
- Average of relative impact factors (ARIF);
- Average of relative citations (ARC);
- International collaboration rate;
- Interinstitutional collaboration rate;
- Number and share of papers acknowledging CIHR as a funding source.
Number of Publications: Each publication authored by a researcher is counted once for that researcher, regardless of the number of co-authors. However, when a group of researchers is considered as a whole (for example the cohort of Project Grant Program applicants rejected at Stage 1), each publication is counted once, even if it was authored by more than one researcher belonging to that group. Although OST database includes several types of documents, only articles, research notes and review papers are typically selected in producing bibliometric studies as these are the primary means of disseminating new knowledge.
Average Annual Number of Publications: The total number of distinct publications assigned to a group of researchers is divided by the number of researchers in the group and the number of years considered in the observation window. For example, the group of 133 Foundation Grant Program applicants rejected at Stage 2 has published 5,593 papers during the 7 years prior to competition. Thus, their average number of publications (calculated in Figure 3-1 ) is 6.0 (5,593 / (133 x 7)).
Average Relative Impact Factor (ARIF): This indicator provides a measure of the scientific impact of the journals in which a group of researchers publishes. Each journal has an impact factor (IF), which is calculated annually based on the average number of citations received by the papers it published during the two previous years. The value of a journal's IF is assigned to each paper it publishes. In order to account for different citation patterns across fields and subfields (e.g., there are more citations in biomedical research than mathematics), each paper's IF is then divided by the average IF of the papers in its particular subfield in order to obtain a Relative Impact Factor (RIF). The ARIF of a given institution (or group of researchers) is computed using the average RIF of all papers belonging to it. When the ARIF is greater than 1, it means that this institution (or group of researchers) publishes in journals that are cited more often than the world average; when it is below 1, it publishes in journals that are not cited as often as the world average. It should also be noted that this indicator is set to nonsignificant (n.s.) when the number of publications involved is below 30. Also, since the distribution of the relative impact factors is skewed, we performed Mann-Whitney U statistical tests in order to probe the statistical significance of observed differences.
Where:
Impact factor of the paper (p) of the subfield (s) published in a given year (y);
Average impact factors of papers of the subfield (s) published in the same year (y);
Total number of papers (of a given country or institution)
Average of Relative Citations (ARC): This indicator is based on the number of citations received by a published paper over the period covered by the database following the publication year. Thus, for papers published in 2007, citations received between 2008 and 2013 are counted. For papers published in 2008, citations received between 2009 and 2013 are counted, and so on. Author self-citations are included. The number of citations received by each paper is normalized by the average number of citations received by all papers published during the same year in the same subfield, hence taking into account the fact that older papers are more cited than more recent ones and that citation practices are different for each specialty. An ARC value greater than 1 means that a paper or a group of papers scores higher than the world averageof its specialty; while a value below 1, shows that those publications are not cited as often as the world average. It should also be noted that this indicator is set to nonsignificant (n.s.) when the number of publications involved is below 30. Also, since the distribution of the relative citations is skewed, we performed Mann-Whitney U statistical tests in order to probe the statistical significance of observed differences.
Where:
Impact factor of the paper (p) of the subfield (s) published in a given year (y);
Average number of citations by papers of the subfield (s) published in the same year (y);
Total number of papers (of a given country or institution).
International collaboration rate: This is an indicator of the relative intensity of scientific collaboration between countries. A paper is considered to be written in international collaboration when it bears addresses from a least two different countries; for example, a Canadian researcher co-authoring a paper with a researcher from a foreign institution. The rate is calculated by dividing the number of international collaborations by the total number of papers
Interinstitutional collaboration rate: This is an indicator of the relative intensity of scientific collaboration between institutions. A paper is considered to be written in interinstitutional collaboration when it bears addresses from a least two different institutions; for example, a researcher from Ottawa Hospital co-authoring a paper with a researcher from the University of Toronto. The rate is calculated by dividing the number of interinstitutional collaborations by the total number of papers.
Growth Rate: This indicator captures the output of an entity [person or population] over two time periods to assess growth in output. It measures the ratio (or percentage) change in output between a recent period and a prior period. The two periods used are 2008-2015 vs 2000-2007.
3 Results
For each of the two programs, the bibliometric indicators were calculated for both the 7-year period prior to each competition as well as for the period ranging from 2000 to one year prior to the competition. The results were essentially the same and therefore the results for the 7-year window are presented here whilst the second set of results are presented in the Appendix (Subsection 5.2). For the subset of papers published by the applicants in the fields of clinical medicine and biomedical research, we also provide benchmark indicators allowing for comparison between applicants (FGP and PGP) and Canada as a whole, as well as selected OECD countries - Australia, France, Germany, Netherlands, Switzerland, United Kingdom and the United States.
3.1 Foundation Grant Program
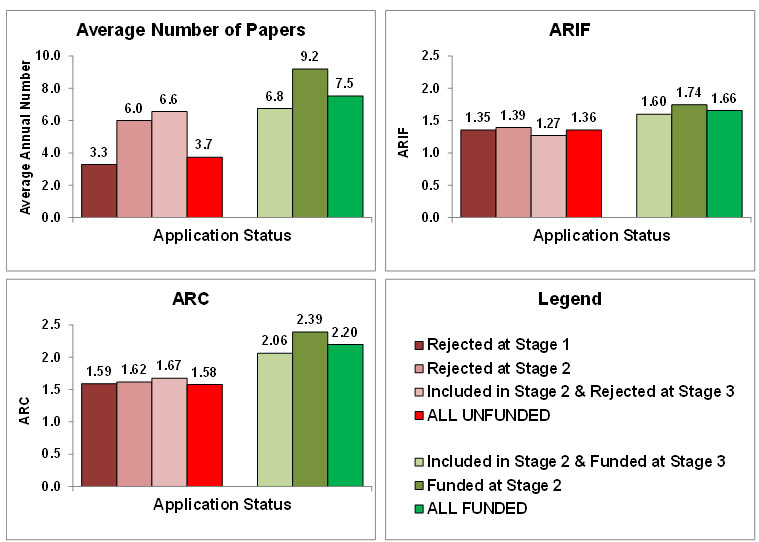
The results presented below in Figure 3-1 and Figure 3-2 show that the Foundation Grant Program's peer review process does select the highest caliber health researchers for funding.
Figure 3-1 Number of Publications and Impact of Papers from Foundation Grant Program Applicants (2014 & 2015) by Application Status for an Observation Window of 7 Years Prior to Competition
Source: Observatoire des sciences et des technologies (Web of Science, data provided by Clarivate Analytics) - CBDTM Current as of August 2016.
NB: Bars are presented in ascending order of bibliometric scores as noted in the introductory section.
Figure 3-1 long description
| Application Status | Average Number of Papers | ARIF | ARC |
|---|---|---|---|
| Rejected at Stage 1 | 3.3 | 1.35 | 1.59 |
| Rejected at Stage 2 | 6.0 | 1.39 | 1.62 |
| Included in Stage 2 & Rejected at Stage 3 |
6.6 | 1.27 | 1.67 |
| All Unfunded | 3.7 | 1.36 | 1.58 |
| Included in Stage 2 & Funded at Stage 3 |
6.8 | 1.60 | 2.06 |
| Funded at Stage 2 | 9.2 | 1.74 | 2.39 |
| All Funded | 7.5 | 1.66 | 2.20 |
Figure 3-1 shows the volume and the impact of publications produced by both cohorts (2014 and 2015) of applicants to the Foundation Grant Program. It shows that:
- The average annual number of papers produced by funded applicants (7.5) is almost twice as high as that of unfunded ones (3.7). It should also be noted that all three categories of unfunded applicants (Rejected at Stages 1, 2 or 3) are, on average, less productive than the two categories of funded applicants. However, the difference between the researchers funded at Stage 3 (6.8) and those rejected at Stage 3 (6.6) and at Stage 2 (6.0) is relatively small. As expected, the most productive researchers are those who were funded at Stage 1 (9.2).
- Along the same lines, impact indicators show that all categories of funded applicants published in more visible journals (ARIF) than their unfunded colleagues and that their papers also are more cited (ARC).
- All differences of ARIF scores shown in Figure 3-1 are statistically significant (p. < 0.001), except for those between applicants rejected at Stage 1 (1.35) and those rejected at Stage 2 (1.39) and Stage 3 (1.27). That is, the differences in ARIF scores among the three categories of unfunded applicants are not statistically significant, but by contrast the differences between each of them and the two categories of funded applicants are statistically significant.
- Similarly, all differences of ARC scores are statistically significant (p. < 0.001) except for those between applicants rejected at Stage 1 (1.59), Stage 2 (1.62) and Stage 3 (1.67). That is, the differences in ARC scores among the three categories of unfunded applicants are not statistically significant, but by contrast the differences between each of them and the two categories of funded applicants are statistically significant.
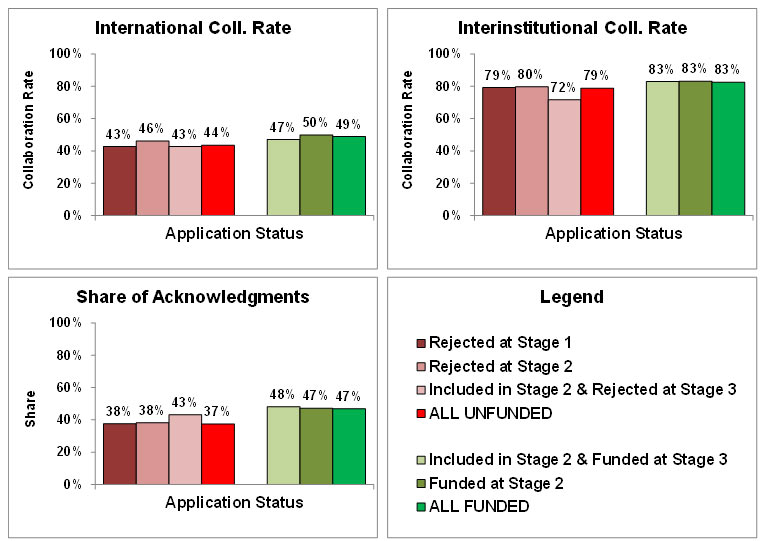
Figure 3-2 Collaboration and Acknowledgment in Papers from Foundation Grant Program Applicants (2014 & 2015) by Application Status for an Observation Window of 7 Years Prior to Competition
Source: Observatoire des sciences et des technologies (Web of Science, data provided by Clarivate Analytics) - CBDTM Current as of August 2016.
NB: Bars are presented in ascending order of bibliometric scores.
Figure 3-2 long description
| Application Status | International Coll. Rate | Interinstitutinal Coll. Rate | Share of Acknowledgments |
|---|---|---|---|
| Rejected at Stage 1 | 43% | 79% | 38% |
| Rejected at Stage 2 | 46% | 80% | 38% |
| Included in Stage 2 & Rejected at Stage 3 |
43% | 72% | 43% |
| All Unfunded | 44% | 79% | 37% |
| Included in Stage 2 & Funded at Stage 3 |
47% | 83% | 48% |
| Funded at Stage 2 | 50% | 83% | 47% |
| All Funded | 49% | 83% | 47% |
Figure 3-2 presents the collaboration rates of applicants as well as the share of their papers acknowledging CIHR. It shows that:
- All categories of funded applicants collaborate slightly more at the international and interinstitutional levels than their unfunded peers. Since both funded and unfunded applicants have produced more than 14,000 papers during the studied period, the margin of error of their respective collaboration rates is about 1.0 percentage point 99 times out of 100. Thus, the differences for the international collaboration rates and interinstitutional collaboration rates between funded and unfunded are statistically significant. However, one should take into account that differences of 5 percentage points or less remain relatively small in practical terms.
- Funded applicants are more likely to have authored publications acknowledging CIHR prior to the competitions (47%) than their unfunded peers (37%) and, in this respect, the difference is more important. This finding that funded researchers are more likely to acknowledge CIHR as a funding source in their publications seems to lend support to current efforts by CIHR's Performance, Measurement, Reporting and Data Unit at using such acknowledgements as one of the proxy measures for the impact of CIHR's support for researchers.
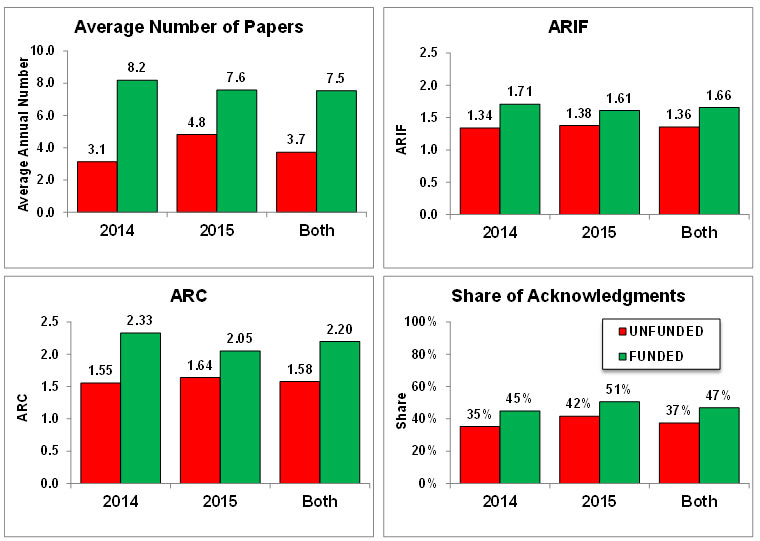
Figure 3-3 Number of Publications, Impact of Papers and Acknowledgments from Foundation Grant Program Applicants by Competition Year and Funding Status for an Observation Window of 7 Years Prior to Competition
Source: Observatoire des sciences et des technologies (Web of Science, data provided by Clarivate Analytics) - CBDTM Current as of August 2016.
Additional data by application status (categories) are available in Fig. 5-1 and Fig. 5-2 in the Appendix.
Figure 3-3 long description
| Average Number of Papers | 2014 | 2015 | Both |
|---|---|---|---|
| Unfunded | 3.1 | 4.8 | 3.7 |
| Funded | 8.2 | 7.6 | 7.5 |
| ARIF | |||
| Unfunded | 1.34 | 1.38 | 1.36 |
| Funded | 1.71 | 1.61 | 1.66 |
| ARC | |||
| Unfunded | 1.55 | 1.64 | 1.58 |
| Funded | 2.33 | 2.05 | 2.20 |
| Share of Acknowledgments | |||
| Unfunded | 35% | 42% | 37% |
| Funded | 45% | 51% | 47% |
How do applicants to the first Foundation Grant Program competition compare with those to the second FGP competition in terms of bibliometric indices? We found in this comparison that the results were quite different from what we expected a priori. Indeed, as shown in Figure 3-3, most bibliometric indices of funded applicants decreased from one competition year to the other, while those of unfunded applicants increased. More specifically:
- The average annual number of publications of funded applicants went from 8.2 in 2014 to 7.6 in 2015. Similarly, their ARIF score decreased for 1.71 to 1.61, and their ARC score, from 2.33 to 2.05, both differences being statistically significant (p. < 0.001).
- At the same time, the average annual number of publications of unfunded applicants increased from 3.1 to 4.8. Their ARIF (from 1.34 to 1.38) and ARC (from 1.55 to 1.64) scores also improved slightly (p. < 0.01).
The funded group in 2014 scored higher on average number of publications, ARIF and ARC scores as compared to the funded group in 2015 and also for each competition, the gap between the funded and unfunded on each of the three indices was larger in 2014 than 2015. These combined findings suggest that there was stronger competition in 2014 than 2015. It should be noted that researchers funded in 2014 were no longer part of the competition the following year, while several applicants who were not funded in 2014 tried again for the 2015 competition and had a second chance to be part of the group of funded researchers. In other words, in 2015, the best applicants from the 2014 competition were excluded (because they received funding in 2014). Therefore, the group of funded applicants in 2015 was necessarily comprised of researchers whose publication files were not as excellent as those of the applicants funded in 2014. On another matter, the improvement of the bibliometric scores of the unfunded applicants between the 2014 and 2015 competitions can probably be explained, in part, by the fact that the 2015 competition attracted fewer applicants (n. = 419) than that of 2014 (n. = 618). Most likely, the applicants that were not funded in 2014 who did not to apply again in 2015 were those with the weakest publication files. Along the same lines, it should also be noted that 357 applicants were rejected at Stage 1 during the 2014 competition but only 249 for the 2015 competition. Globally, one should note that Figure 3-3 clearly shows that, for both competitions, the applicants selected for funding have better publication files than the unfunded ones. In that sense, the peer review process could be said to be playing its expected role.
3.2 Project Grant Program
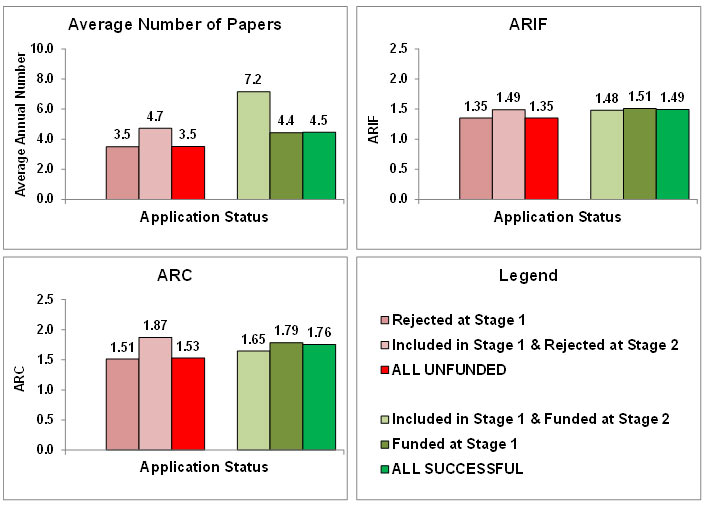
Data presented in the two figures below show that the peer review process of the Project Grant Program does select the highest caliber health researchers for funding. However, it also shows that the excellence of publication files is not necessarily the sole criterion used by the reviewers.
Figure 3-4 Number of Publications and Impact of Papers from Project Grant Program Applicants (2016) by Application Status for an Observation Window of 7 Years Prior to Competition.
Source: Observatoire des sciences et des technologies (Web of Science, data provided by Clarivate Analytics) - CBDTM Current as of August 2016.
Figure 3-4 long description
| Application Status | Average Number of Papers | ARIF | ARC |
|---|---|---|---|
| Rejected at Stage 1 | 3.5 | 1.35 | 1.51 |
| Included in Stage 1 & Rejected at Stage 2 |
4.7 | 1.49 | 1.87 |
| All Unfunded | 3.5 | 1.35 | 1.53 |
| Included in Stage 1 & Funded Stage 2 |
7.2 | 1.48 | 1.65 |
| Funded at Stage 1 | 4.4 | 1.51 | 1.79 |
| All Successful | 4.5 | 1.49 | 1.76 |
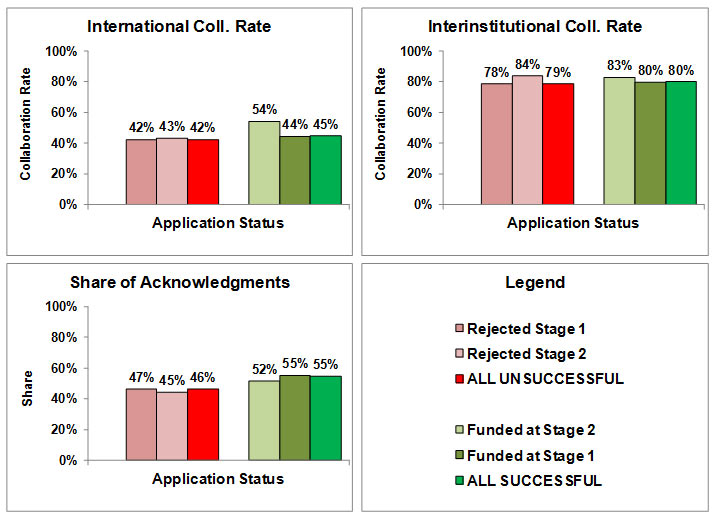
Figure 3-5 Collaboration and Acknowledgment to CIHR in Papers from Project Grant Program Applicants (2016) by Application Status for an Observation Window of 7 Years Prior to Competition
Source: Observatoire des sciences et des technologies (Web of Science, data provided by Clarivate Analytics) - CBDTM Current as of August 2016.
Figure 3-5 long description
| Application Status | International Coll. Rate | Interinstitutinal Coll. Rate | Share of Acknowledgment |
|---|---|---|---|
| Rejected Stage 1 | 42% | 78% | 47% |
| Rejected Stage 2 | 43% | 84% | 45% |
| All Unsuccessful | 42% | 79% | 46% |
| Funded at Stage 2 | 54% | 83% | 52% |
| Funded at Stage 1 | 44% | 80% | 55% |
| All Successful | 45% | 80% | 55% |
Figure 3-5 presents the collaboration rates of applicants as well as the share of their papers acknowledging CIHR. It shows that:
- All categories of funded applicants collaborate slightly more at the international level than their unfunded peers but, except for the applicants funded at Stage 2, differences between groups are quite small. Along the same lines, there is almost no difference between the interinstitutional collaboration rates of the various groups.
- As was the case for the Foundation Grant Program, all categories of funded applicants have authored more publications acknowledging CIHR than the unfunded applicants (46% vs 55%).
3.3 Benchmark indicators
The benchmark indicators presented in this sub-section show that both the Foundation Grant Program and the Project Grant Program attracted high caliber researchers who, generally speaking, have higher scientific impact in the field of health research than that of average researchers from Canada or other selected OECD countries. This is true for funded researchers and in most cases, also for the unfunded ones. Additionally, all applicants to both programs, irrespective of funding status outperform the rest of the world researchers (all bibliometric indices exceed 1.0).
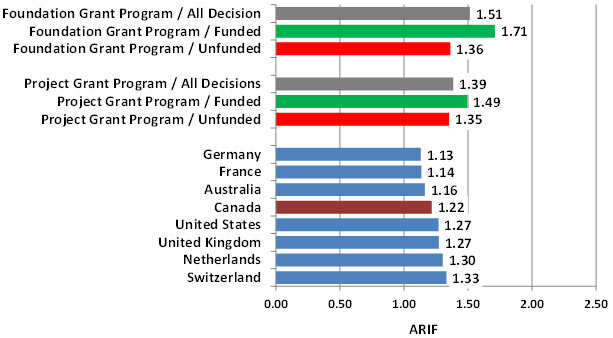
Figure 3-6 Average of Relative Impact Factors (ARIF) of Health Research Papers from Foundation and Project Grant Programs Applicants and from OECD Countries, 2008-2015
Source: Observatoire des sciences et des technologies (Web of Science, data provided by Clarivate Analytics) - CBDTM Current as of August 2016.
Figure 3-6 long description
| Foundation Grant Program / All Decision | 1.51 |
| Foundation Grant Program / Funded | 1.71 |
| Foundation Grant Program / Unfunded | 1.36 |
| Project Grant Program / All Decisions | 1.39 |
| Project Grant Program / Funded | 1.49 |
| Project Grant Program / Unfunded | 1.35 |
| Germany | 1.13 |
| France | 1.14 |
| Australia | 1.16 |
| Canada | 1.22 |
| United States | 1.27 |
| United Kingdom | 1.27 |
| Netherlands | 1.30 |
| Switzerland | 1.33 |
Health research papers, namely papers published in journals dedicated to clinical medicine and biomedical research account for about 85% of all the publications produced by the applicants to the Foundation and Project Grant Programs. Thus, this subset of papers offers a good basis for the comparison between the scientific production of CIHR applicants and Canada as a whole, as well as other OECD countries.
Figure 3-6 presents for each group of researchers, the average of relative impact factors for the 2008-2015 period. It shows that:
- The ARIF scores of funded applicants to both the Foundation Grant Program (ARIF = 1.71) and Project Grant Program (1.49) are much higher than that of Canada as a whole (1.22) and also higher than that of any other OECD country. Hence, funded applicants tend to publish their research results in more visible journals than their Canadian and foreign colleagues.
- Moreover, the ARIF of unfunded applicants to the Foundation Grant Program (1.36) and the Project Grant Program (1.33) is higher than that of Canada as a whole and higher or at par with that of other OECD countries
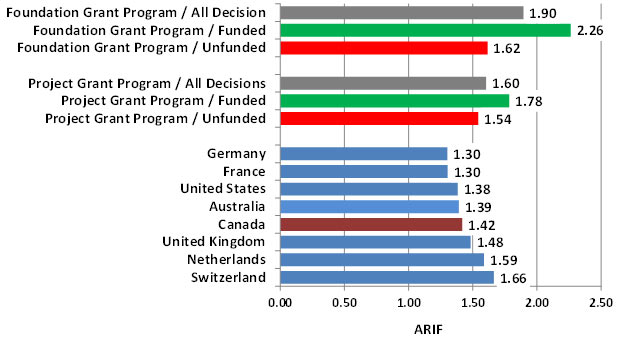
Figure 3-7 Average of Relative Citations (ARC) of Health Research Papers from Foundation and Project Grant Programs Applicants and from OECD Countries, 2008-2015
Source: Observatoire des sciences et des technologies (Web of Science, data provided by Clarivate Analytics) - CBDTM Current as of August 2016.
Figure 3-7 long description
| Foundation Grant Program / All Decision | 1.90 |
| Foundation Grant Program / Funded | 2.26 |
| Foundation Grant Program / Unfunded | 1.62 |
| Project Grant Program / All Decisions | 1.60 |
| Project Grant Program / Funded | 1.78 |
| Project Grant Program / Unfunded | 1.54 |
| Germany | 1.30 |
| France | 1.30 |
| United States | 1.38 |
| Australia | 1.39 |
| Canada | 1.42 |
| United Kingdom | 1.48 |
| Netherlands | 1.59 |
| Switzerland | 1.66 |
Figure 3-7 presents the average of relative citations for the 2008-2015 period. It shows that:
- The ARC scores of funded applicants to both Foundation Grant Program (ARC = 2.26) and Project Grant Program (1.78) are much higher than that of Canada as a whole (1.42) and also higher than that of any other OECD country. Hence, the publications of CIHR funded applicants are on average more cited than that of their Canadian and foreign colleagues.
- Also, the ARCs of unfunded applicants to the Foundation Grant Program (1.62) and the Project Grant Program (1.54) are higher than that of Canada as a whole and higher than that of most of the selected OECD countries.
These findings confirm that the two Programs are attracting applicants who outperform their Canadian and international colleagues in terms of journals in which they publish their research and how often their work is cited.
4 Conclusion
The table below matches each study question with its overall conclusion and corresponding source of the evidence.
Table 4-1 Matching Study Questions, Conclusions and Figures
| Study Question | Conclusion | Figures |
|---|---|---|
| Is the peer review process selecting the most high caliber health researchers for the Foundation and Project Grant Programs? That is, how do selected applicants compare with unselected applicants in terms of their bibliometric indices? | Yes, the programs select the best from the available applicants. In broad terms, the average score for funded applicants is consistently higher than that of unfunded applicants across all indices.
Additionally, for FGP, bibliometric scores correspond with peer review rankings.Footnote * |
FGP:
Fig. 3-1, Fig. 3-2. PGP: Fig. 3-4, Fig. 3-5. |
| How do applicants to the first Foundation Grant Program competition compare with those to the second FGP competition in terms of bibliometric indices? | The 2014 cohort of FGP applicants outperformed the 2015 cohort in terms of average number of publications, ARIF and ARC but not in proportion of publications that acknowledged CIHR support. | Fig. 3-3 |
| Do peer reviewers appear to be using the same criteria to select applicants in both the Foundation and Project Grant Programs? That is, is the association between peer review rankings and bibliometric indices the same or different in the Foundation and Project Grant Programs? | Peer review in the FGP appears to be more aligned with researchers’ productivity and impact whereas in the PGP, additional factors seem to be at play.
Among FGP applicantsFootnote *, bibliometric scores (for all indices) consistently corresponded with peer review rankings but the relationship was inconsistent for PGP applicantsFootnote **. |
Fig. 3-4 and Fig. 3-5 for PGP and Fig. 3-1 and Fig 3-2 for FGP. |
| Are the Foundation Grant and Project Grant Programs attracting the most high caliber health researchers? That is, how do the respective applicant pools compare with health researchers in Canada, selected OECD countries and the rest of the world, in terms of their bibliometric indices? | For both FGP and PGP, funded applicants outperform Canadian and OECD researchers in terms of ARIF and ARC scores. Unfunded applicants outperform all except ARC scores for Netherlands and Switzerland.
All applicants irrespective of funding status outperform the rest of the world researchers. |
Fig. 3-6 and Fig. 3-7. |
Using bibliometric data, this study measured the publication output of three recent cohorts of applicants; two from the Foundation Grant Program (2014 and 2015) and one from the Project Grant Program (2016), for the assessment of CIHR's reformed peer review process. More specifically, we measured the publication files of applicants prior to the competition to assess the ability of the new peer review process to choose the highest caliber researchers in the context of the Foundation Grant Program and to select the best and most feasible research ideas for the Project Grant Program.
The results obtained for the two cohorts from the Foundation Grant Program are, to a large extent, in line with our working hypothesis. Indeed, the applicants rejected at the beginning of the review process (Stage 1) are those who show the lowest performances in terms of publications. They are less productive than the other categories of applicants (those who were selected for the subsequent stages), they have a lower scientific impact (ARIF and ARC) and their collaboration rates (international and interinstitutional) are among the lowest. In terms of productivity and scientific impact, they are followed by the group of applicants rejected at Stage 2, then by applicants rejected at Stage 3,Footnote 9 then by applicants accepted for funding at Stage 3 and finally, by the applicants who were funded at the earliest stage (Stage 2) of the competitions. These trends are weaker for the collaboration indicators, but on the whole, the rates of the funded applicants are slightly higher than that of the unfunded ones. In short, our results confirm that the successive stages of the peer review process used by the Foundation Grant Program actually tend to select the highest caliber of researchers, at least in terms of publication output.
The results obtained for the Project Grant Program offer a somewhat different picture. On the whole, the applicants selected for funding have on average, better publication files than the unfunded ones. On the other hand, from one stage of the peer review process to the next, the trends are not as clear as those observed with the Foundation Grant Program. To a certain extent, they are contrary to our working hypothesis of a good correspondence between the successive stages of the peer review process and the progression of the bibliometric indicators. For example, the applicants to the Project Grant Program rejected at Stage 2 produced more publications than those funded at Stage 1 and they also had a better ARC score. Along the same lines, applicants funded at Stage 2 are also more productive than those funded at Stage 1. This tends to prove that the quality of a researcher's publication file is not necessarily the sole criterion used by the reviewers for the evaluation of his/her application. In the context of the Project Grant Program, this may also suggest that other factors like the quality, relevance and originality of the proposed project are also taken into account.
The results obtained for the Project Grant Program offer a somewhat different picture. On the whole, the applicants selected for funding have on average, better publication files than the unfunded ones. On the other hand, from one stage of the peer review process to the next, the trends are not as clear as those observed with the Foundation Grant Program. To a certain extent, they are contrary to our working hypothesis of a good correspondence between the successive stages of the peer review process and the progression of the bibliometric indicators. For example, the applicants to the Project Grant Program rejected at Stage 2 produced more publications than those funded at Stage 1 and they also had a better ARC score. Along the same lines, applicants funded at Stage 2 are also more productive than those funded at Stage 1. This tends to prove that the quality of a researcher's publication file is not necessarily the sole criterion used by the reviewers for the evaluation of his/her application. In the context of the Project Grant Program, this may also suggest that other factors like the quality, relevance and originality of the proposed project are also taken into account.
Finally, the benchmark indicators presented in sub-section 3.3 show that in the field of health research, the Foundation and Project Grant Programs are attracting high caliber researchers since applicants to both Programs, irrespective of funding status, have a higher scientific impact than all researchers from Canada and, in most cases, from other OECD countries.
5 Appendix
5.1 Indicators for the Foundation Grant Program by Competition Year
Figure 5-1 Number of Publications and Impact of Papers from Foundation Grant Program Applicants by Competition Year and Application Status for an Observation Window of 7 Years Prior to Competition
Competition Year 2014
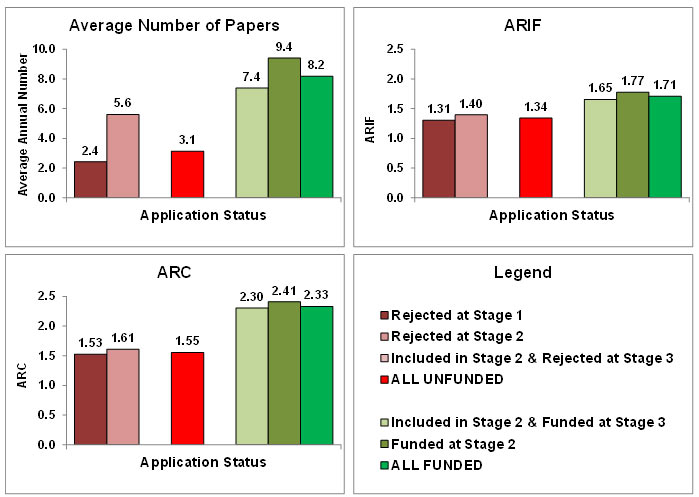
Figure 5-1a long description
| Application Status | Average Number of Papers | ARIF | ARC |
|---|---|---|---|
| Rejected at Stage 1 | 2.4 | 1.31 | 1.53 |
| Rejected at Stage 2 | 5.6 | 1.40 | 1.61 |
| Included in Stage 2 & Rejected at Stage 3 |
|||
| All Unfunded | 3.1 | 1.34 | 1.55 |
| Included in Stage 2 & Funded at Stage 3 |
7.4 | 1.65 | 2.30 |
| Funded at Stage 2 | 9.4 | 1.77 | 2.41 |
| All Funded | 8.2 | 1.71 | 2.33 |
Competition Year 2015
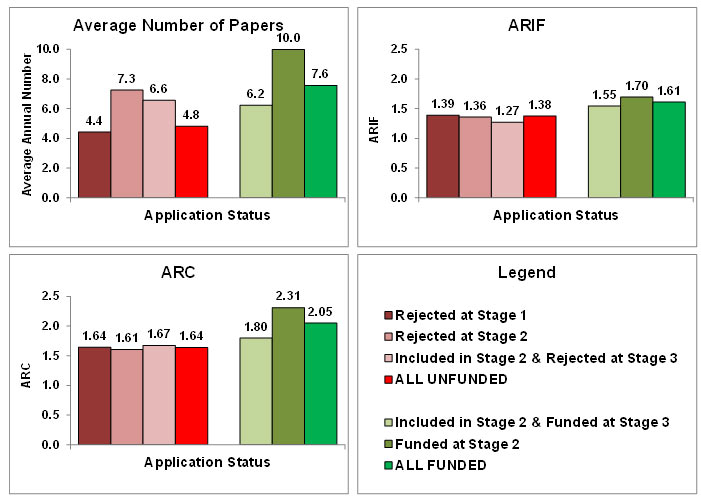
Source: Observatoire des sciences et des technologies (Web of Science, data provided by Clarivate Analytics) - CBDTM Current as of August 2016.
Note that these charts are a disaggregation of Fig. 3-3 into the two years, 2014 and 2015.
Figure 5-1b long description
| Application Status | Average Number of Papers | ARIF | ARC |
|---|---|---|---|
| Rejected at Stage 1 | 4.4 | 1.39 | 1.64 |
| Rejected at Stage 2 | 7.3 | 1.36 | 1.61 |
| Included in Stage 2 & Rejected at Stage 3 |
6.6 | 1.27 | 1.67 |
| All Unfunded | 4.8 | 1.38 | 1.64 |
| Included in Stage 2 & Funded at Stage 3 |
6.2 | 1.55 | 1.80 |
| Funded at Stage 2 | 10.0 | 1.70 | 2.31 |
| All Funded | 7.6 | 1.61 | 2.05 |
Figure 5-2 Publications in Collaboration and Acknowledgment in Papers from Foundation Grant Program Applicants by Competition Year and Application Status for an Observation Window of 7 Years Prior to Competition
Competition Year 2014
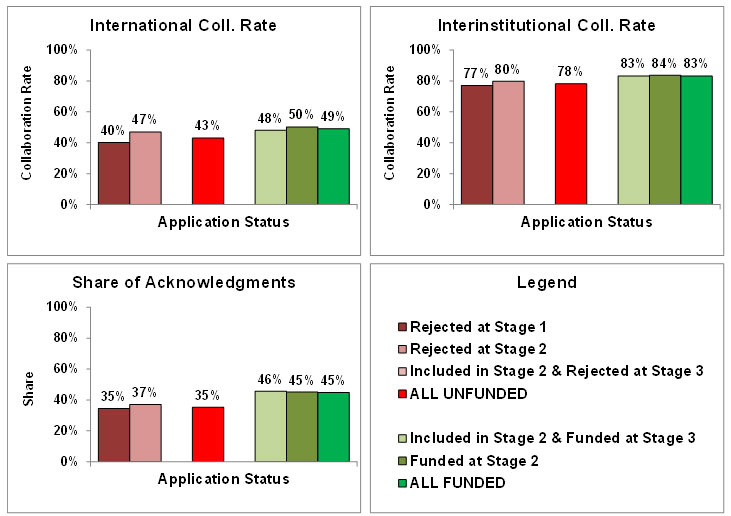
Figure 5-2a long description
| Application Status | International Coll. Rate | Interinstitutinal Coll. Rate | Share of Acknowledgment |
|---|---|---|---|
| Rejected at Stage 1 | 40% | 77% | 35% |
| Rejected at Stage 2 | 47% | 80% | 37% |
| Included at Stage 2 & Rejected at Stage 2 |
|||
| All Unfunded | 43% | 78% | 35% |
| Included at Stage 2 & Funded at Stage 3 |
48% | 83% | 46% |
| Funded at Stage 2 | 50% | 84% | 45% |
| All Funded | 49% | 83% | 45% |
Competition Year 2015
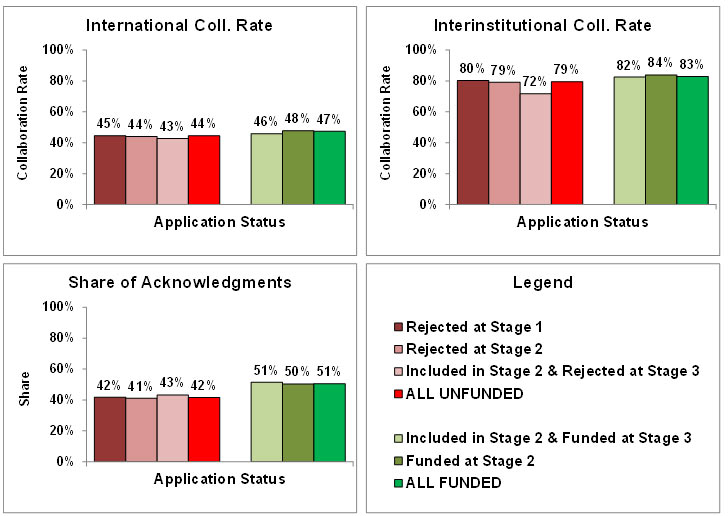
Source: Observatoire des sciences et des technologies (Web of Science, data provided by Clarivate Analytics) - CBDTM Current as of August 2016.
Note that these charts are a disaggregation of Fig. 3-3 into the two years, 2014 and 2015.
Figure 5-2b long description
| Application Status | International Coll. Rate | Interinstitutinal Coll. Rate | Share of Acknowledgment |
|---|---|---|---|
| Rejected at Stage 1 | 45% | 80% | 42% |
| Rejected at Stage 2 | 44% | 79% | 41% |
| Included at Stage 2 & Rejected at Stage 3 |
43% | 72% | 43% |
| All Unfunded | 44% | 79% | 42% |
| Included in Stage 2 & Funded at Stage 3 |
46% | 82% | 51% |
| Funded at Stage 2 | 48% | 84% | 50% |
| All Funded | 47% | 83% | 51% |
5.2 Productivity and Impact Indicators for an Observation Window from 2000 to One Year Prior to Competition
Figure 5-3 shows for the Foundation Grant Program, the same indicators as Figure 3-1, but instead of being compiled for the 7-year period prior to competition, they cover the period ranging from year 2000 to one year prior to the competition. The covered period is thus twice as long, but the trends remain essentially the same. Indeed:
- The impact indicators (ARIF and ARC) of the publications from all categories of funded applicants are clearly higher than those of all categories of unfunded ones.
- Overall, funded applicants are also more productive than unfunded applicants. However, one exception should be noted: applicants rejected at Stage 3 appear to have published slightly more papers (5.7) than their peers who were funded at the same stage (5.3).
Figure 5-3 Number of Publications and Impact of Papers from Foundation Grant Program Applicants (2014 & 2015) by Application Status for an Observation Window from 2000 to One Year Prior to Competition
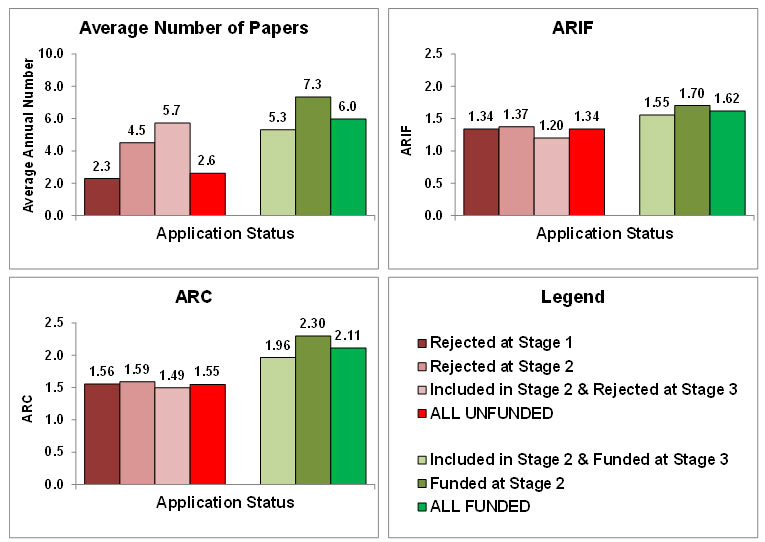
Source: Observatoire des sciences et des technologies (Web of Science, data provided by Clarivate Analytics) - CBDTM Current as of August 2016.
Figure 5-3 long description
| Application Status | Average Number of Papers | ARIF | ARC |
|---|---|---|---|
| Rejected at Stage 1 | 2.3 | 1.34 | 1.56 |
| Rejected at Stage 2 | 4.5 | 1.37 | 1.59 |
| Included at Stage 2 & Rejected at Stage 3 |
5.7 | 1.20 | 1.49 |
| All Unfunded | 2.6 | 1.34 | 1.55 |
| Included in Stage 2 & Funded at Stage 3 |
5.3 | 1.55 | 1.96 |
| Funded at Stage 2 | 7.3 | 1.70 | 2.30 |
| All Funded | 6.0 | 1.62 | 2.11 |
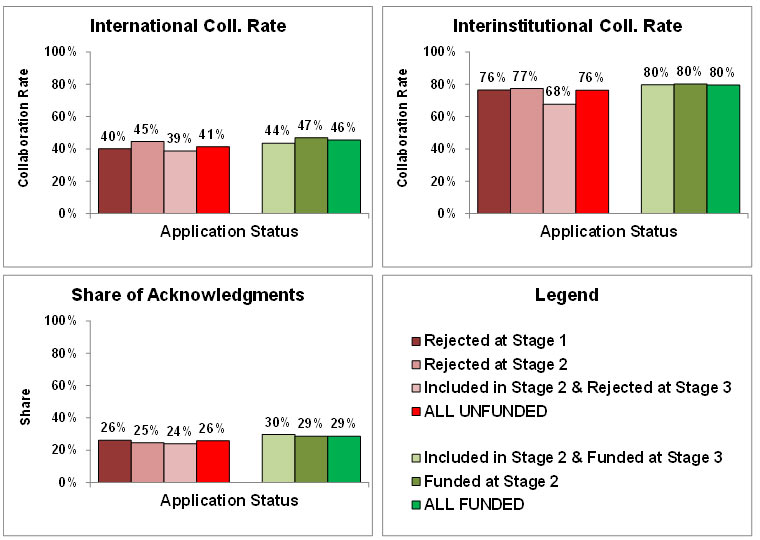
Similarly, Figure 5-4 presents the same indicators as Figure 3-2, but for the larger observation windows (beginning in 2000). It shows that:
- The international and interinstitutional collaboration rates of all categories of funded applicants are slightly higher than that of all the categories of unfunded ones.
- For this longer period, all shares of papers acknowledging CIHR are smaller than that of the 7-year period because acknowledgments have only been included in Web of Science records since 2008. However, the trend shown in Figure 5-4 remains essentially the same as the one shown for the 7-year period in Figure 3-2 . All categories of unfunded applicants show a slightly lower share of papers acknowledging CIHR than the funded ones.
Figure 5-4 Collaboration and Acknowledgment to CIHR in Papers from Foundation Grant Program Applicants (2014 & 2015) by Application Status for an Observation Window from 2000 to One Year Prior to Competition
Source: Observatoire des sciences et des technologies (Web of Science, data provided by Clarivate Analytics) - CBDTM Current as of August 2016.
Figure 5-4 long description
| Application Status | International Coll. Rate | Interinstitutinal Coll. Rate | Share of Acknowledgment |
|---|---|---|---|
| Rejected at Stage 1 | 40% | 77% | 35% |
| Rejected at Stage 2 | 47% | 80% | 37% |
| Included at Stage 2 & Rejected at Stage 3 |
|||
| All Unfunded | 43% | 78% | 35% |
| Included in Stage 2 & Funded at Stage 3 |
48% | 83% | 46% |
| Funded at Stage 2 | 50% | 84% | 45% |
| All Funded | 49% | 83% | 45% |
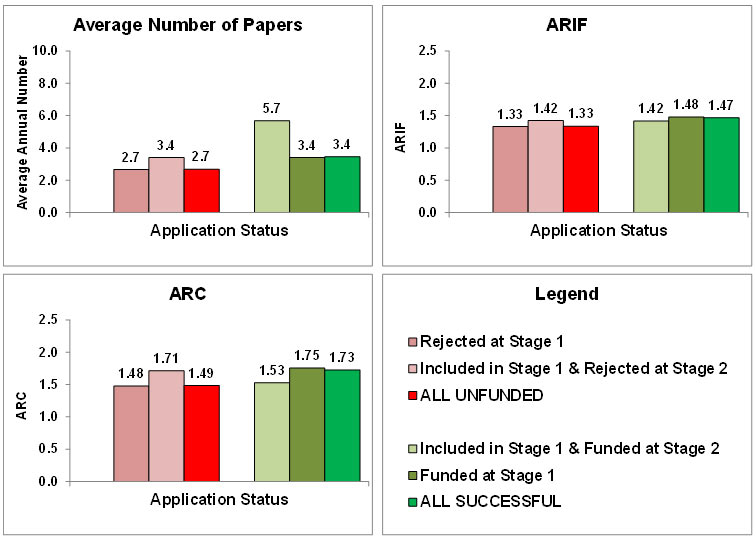
Figure 5-5 shows for the Project Grant Program, the same indicators as Figure 3-4, but instead of being compiled for a 7-year period prior to competition, they cover the period ranging from year 2000 to one year prior to the competition. The covered period is thus twice as long, but the trends remain essentially the same. Indeed:
- The average annual number of papers produced by funded applicants (3.4) is notably higher than that of unfunded applicants (2.7).
- Along the same lines, impact indicators show that funded applicants published in more visible journals (ARIF = 1.47) than their unfunded colleagues (1.33) and that their papers are also more cited (ARC = 1.73 vs 1.49).
- Similar to what was observed with the 7-year observation window, it should be noted that some groups behaved differently than what would have been expected if the excellence of researchers' previous achievements were the sole criterion used by reviewers. Thus, applicants rejected at Stage 2 have an ARC score (1.71) higher than that of applicants funded at Stage 2 (1.53) and on par with that of funded applicants. However, it should be noted that these results should be interpreted with caution since the scores obtained for that group rest on a relatively small number of publications (n. = 2,760) and that the differences with other groups are not statistically significant.
- Another result which tends to confirm that the career achievement of the applicants is not the sole criterion applied by the reviewers is the fact that the average annual number of papers from applicants funded at Stage 2 (5.7) is much higher than that of any other group. However, here again this result should be interpreted with caution. This group only contains 20 researchers; two of whom having authored more than 120 papers during the 15 years of the studied period.
Figure 5-5 Number of Publications and Impact of Papers from Project Grant Program Applicants (2016) by Application Status for an Observation Window from 2000 to One Year Prior to Competition
Source: Observatoire des sciences et des technologies (Web of Science, data provided by Clarivate Analytics) - CBDTM Current as of August 2016.
Figure 5-5 long description
| Application Status | Average Number of Papers | ARIF | ARC |
|---|---|---|---|
| Rejected at Stage 1 | 2.7 | 1.33 | 1.48 |
| Included at Stage 1 & Rejected at Stage 2 |
3.4 | 1.42 | 1.71 |
| All Unfunded | 2.7 | 1.33 | 1.49 |
| Included in Stage 1 & Funded at Stage 2 |
5.7 | 1.42 | 1.53 |
| Funded at Stage 1 | 3.4 | 1.48 | 1.75 |
| All Successful | 3.4 | 1.47 | 1.73 |
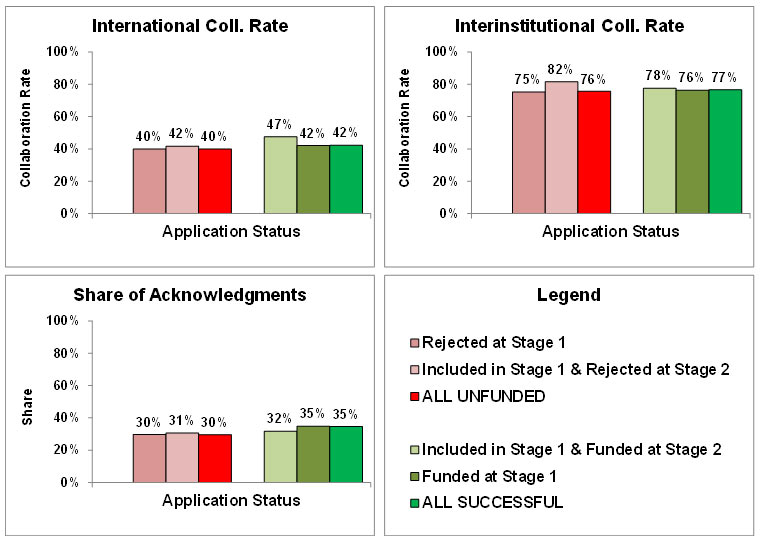
Similarly, Figure 5-6 presents the same indicators as Figure 3-5, but for the larger observation windows (beginning in 2000). It shows that:
- Except for applicants funded at Stage 2 (47%), there is almost no difference between the international collaboration rate of the various groups; which all range from 40% to 42%.
- At the interinstitutional level, all groups show a collaboration rate ranging from 75% to 78%, except for the group of applicants rejected at Stage 2; with a slightly higher rate of 82%.
- All categories of funded applicants have authored more publications acknowledging CIHR prior to the competitions than the unfunded ones. However, one should note that there is only a tiny difference between the applicants rejected at Stage 2 (31%) and those funded at this stage (32%).
Figure 5-6 Collaboration and Acknowledgment to CIHR in Papers from Project Grant Program Applicants (2016) by Application Status for an Observation Window from 2000 to One Year Prior to Competition
Source: Observatoire des sciences et des technologies (Web of Science, data provided by Clarivate Analytics) - CBDTM Current as of August 2016.
Figure 5-6 long description
| Application Status | International Coll. Rate | Interinstitutinal Coll. Rate | Share of Acknowledgment |
|---|---|---|---|
| Rejected at Stage 1 | 40% | 75% | 30% |
| Included at Stage 1 & Rejected at Stage 2 |
42% | 82% | 31% |
| All Unfunded | 40% | 76% | 30% |
| Included in Stage 1 & Funded at Stage 2 |
47% | 78% | 32% |
| Funded at Stage 1 | 42% | 76% | 35% |
| All Successful | 42% | 77% | 35% |
5.3 Growth Rate of the Applicants' Number of Publications (2000-2015)
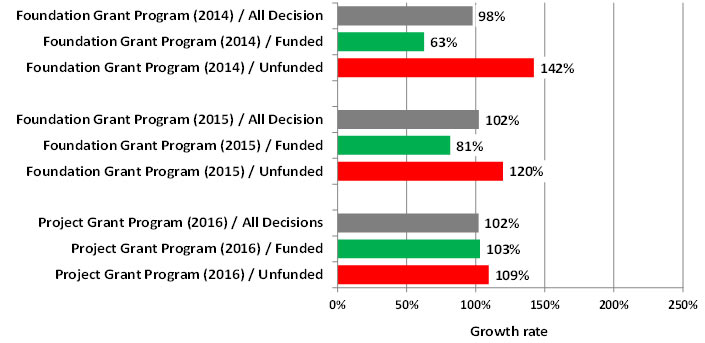
The data presented in Figure 5-7 should be interpreted in context, as it shows that the growth rate of the production of unfunded researchers is higher than that of funded ones. One should recall that the rate is here obtained by comparing, at the level of each group of researchers, the total number of papers produced in 2008-2015 with that of 2000-2007. Since the funded researchers are on average more experienced than the unfunded ones, more particularly in the Foundation Grant Program, it is perfectly normal for their growth rate to be lower than that of their unfunded colleagues, as it is much easier to have a large growth rate when the number for the first period (used as the denominator) is relatively small.
One should note that the differences in the growth rates between the groups reflect pretty well the differences between their average years of experience. While the applicants funded by the Foundation Grant Program in 2014 had 18.4 years of experience, their unfunded colleagues had only 10.8 years of experience. Similarly, for the 2015 competition, the funded applicants had 17.8 years of experience against 14.2 for the unfunded. In the Project Grant Program, the funded researchers had 15.5 years of experience as against 14.3 years for the unfunded ones.
Figure 5-7 Growth Rate of Number of Papers from the 2000-2007 period to the 2008-2015 period by Grant Program and Funding Status
Source: Observatoire des sciences et des technologies (Web of Science, data provided by Clarivate Analytics) - CBDTM Current as of August 2016.
Figure 5-7 long description
| Growth Rate | |
|---|---|
| Foundation Grant Program (2014) / All Decision | 98% |
| Foundation Grant Program (2014) / Funded | 63% |
| Foundation Grant Program (2014) / Unfunded | 142% |
| Foundation Grant Program (2015) / All Decision | 102% |
| Foundation Grant Program (2015) / Funded | 81% |
| Foundation Grant Program (2015) / Unfunded | 120% |
| Project Grant Program (2016) / All Decisions | 102% |
| Project Grant Program (2016) / Funded | 103% |
| Project Grant Program (2016) / Unfunded | 109% |
- Date modified: